Grafana vs Azure Dashboards – Which One to Use & When?
Grafana is an open-source, general purpose dashboard and graph composer, which runs as a web application.
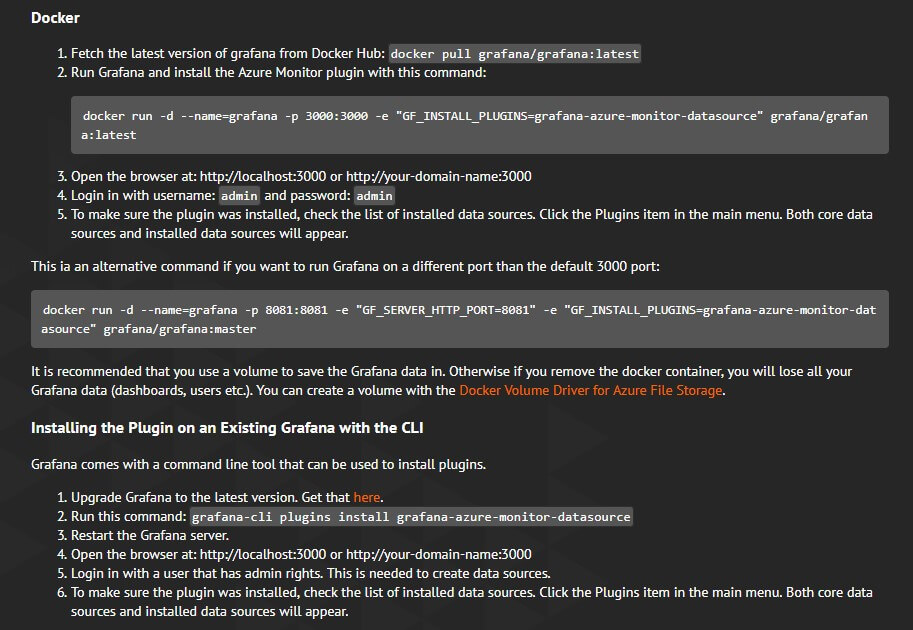
You can monitor Azure services and applications from Grafana using the Azure Monitor data source plugin. The plugin gathers application performance data collected by the Application Insights SDK as well as infrastructure data provided by Azure Monitor. You can then display this data on your Grafana dashboard.
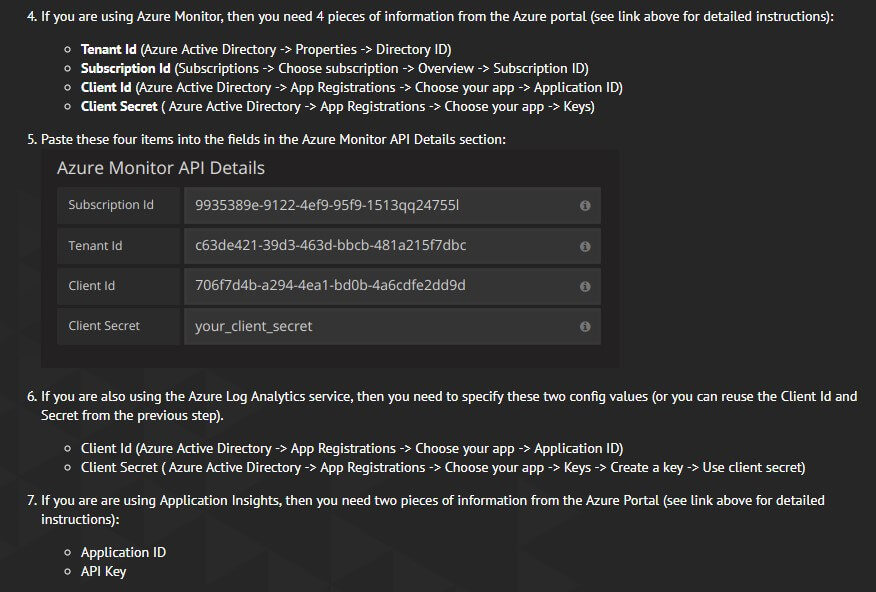
Grafana uses an Azure Active Directory service principal to connect to Azure Monitor APIs and collect metrics data. You must create a service principal to manage access to your Azure resources.
Why Grafana?
Grafana provides more visualization options than the Azure Portal. It also supports multiple data sources. One can combine data from multiple sources in a single dashboard. Grafana is designed for analyzing and visualizing metrics such as system CPU, memory, disk and I/O utilization. Users can create comprehensive charts with smart axis formats (such as lines and points) as a result of Grafana’s fast, client-side rendering — even over long ranges of time.
Grafana dashboards are what made Grafana such a popular visualization tool. Visualizations in Grafana are called panels, and users can create a dashboard containing panels for different data sources. Grafana supports graph, singlestat, table, heatmap and freetext panel types. Grafana users can make use of a large ecosystem of ready-made dashboards for different data types and sources. Grafana has no time series storage support. Grafana is only a visualization solution. Time series storage is not part of its core functionality.
Some of the features of Grafana are as follows
- Optimized for Time series
- Can pull data from Azure Metrics, Log Analytics and Application Insights
- Azure Data Explorer (formerly known as Kusto) plugin also released.
- Rich ecosystem of plugins for data sources and dashboards.
- Open Source, easy to onboard using Docker, Azure App Service etc.
Some of the requirements of Grafana are described below.
- Azure SPN (Service Principal Name) with reader access to subscription
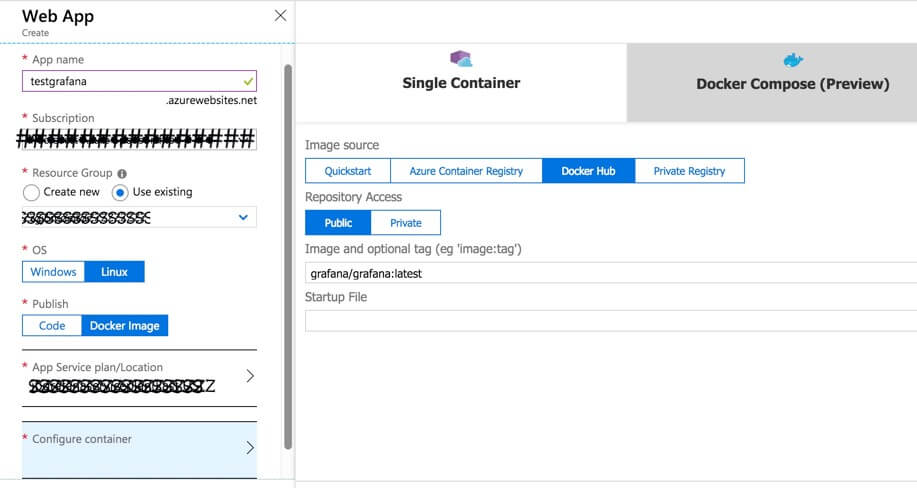
- Deploy in Azure web apps.
- Data source plugin “grafana-azure-monitor-datasource”
- Supports AD integration via LDAP
- Easy to export/import and templatize
- Very DevOps friendly
- Huge collection of panels https://play.grafana.org
Azure Monitor Data Source For Grafana
Azure Monitor is the platform service that provides a single source for monitoring Azure resources. The Azure Monitor Data Source plugin supports Azure Monitor, Azure Log Analytics and Application Insights metrics in Grafana.
Features
- Support for all the Azure Monitor metrics
- includes support for the latest API version that allows multi-dimensional filtering for the Storage and SQL metrics.
- Automatic time grain mode which will group the metrics by the most appropriate time grain value
- Application Insights metrics
- Write raw log analytics queries, and select x-axis, y-axis, and grouped values manually.
- Automatic time grain support
- Support for Log Analytics (both for Azure Monitor and Application Insights)
- You can combine metrics from both services in the same graph.
Azure Monitor for VMs provides an in-depth view of VM health, performance trends, and dependencies. Azure Monitor for VMs includes a set of performance charts that target several key performance indicators (KPIs) to help you determine how well a virtual machine is performing. Azure Monitor for VMs is focused on the operating system as manifested through the processor, memory, network adapters, and disks.
Azure Dashboards
Azure dashboards allow you to combine different kinds of data, including both metrics and logs, into a single pane in the Azure portal. You can optionally share the dashboard with other Azure users. Elements throughout Azure Monitor can be added to an Azure dashboard in addition to the output of any log query or metrics chart. Azure Monitor is single source for monitoring azure resources. Its Azure’s time series database for all azure metrics.
Some of the important aspects of Azure Dashboard
- No setup required, already available within Azure Portal.
- Zoom in zoom out for metrics not available
- All data from Azure resources.
- Log Analytics/AI queries cannot be parameterized based on Dashboard selection.
- Query results can be pinned to dashboards
- Good panels are not tied to products and can’t be customized.
- Eg. percentile panels is only available in “Container Insights” and VM insights.
- The panel cannot be used against “Log Analytics” source or Metric source.
Some of the features of Azure Dashboard are as follows
- Supports visualizing most Azure resources
- OOB Integrated with Azure RBAC
- Supports Log Analytics, App Insights and Metrics
- No Auto refresh per panel
- No Zoom in Zoom out.
- Dashboard queries don’t support variables
Azure Dashboards (VM insights/ Container Insights)
- These tiles can only be accessed by navigating to the VM resource.
- They cannot be pinned as is, but the detailed version of this can be pinned.
- No zoom in zoom out capability.
Azure Dashboards – Metrics
- These are pinnable
- Don’t support percentiles
- No drill ability
- Each Panel is hard coded to a specific data source even if they might be the same behind the scenes.
Comparison between Grafana and Azure Dashboard is shown below.
Azure Dashboard
| Grafana
|
Share this:
CloudIQ is a leading Cloud Consulting and Solutions firm that helps businesses solve today’s problems and plan the enterprise of tomorrow by integrating intelligent cloud solutions. We help you leverage the technologies that make your people more productive, your infrastructure more intelligent, and your business more profitable.
LATEST THINKING
INDIA
Chennai One IT SEZ,
Module No:5-C, Phase ll, 2nd Floor, North Block, Pallavaram-Thoraipakkam 200 ft road, Thoraipakkam, Chennai – 600097
© 2023 CloudIQ Technologies. All rights reserved.