As more and more organizations run their business-critical applications on containers using Azure, there are new challenges in monitoring and managing them. Of course, there is the Azure dashboard, but with elaborate set-ups and such, IT teams feel the need for a more intuitive dashboard to monitor and track Azure services.
The answer, Grafana.
Grafana is an open-source dashboard and graph editor for Graphite, Elasticsearch, OpenTSDB, Prometheus, and InfluxDB. It is a powerful visualization application that deals effectively with large-scale measurement data and time-series data.
As compared to other dashboards, especially the native Azure dashboard, Grafana offers a wider variety of visualization options (graphs, heatmaps, tables, and more) and can collect and collate data from multiple sources. It is designed for evaluating metrics such as system CPU, memory, disk, and I/O utilization.
A Grafana dashboard will help you understand, analyze, monitor, and explore your data with flexible and fast visualization tools.
In this article we will look at using Azure Database for MySQL and Grafana to monitor Azure services
Access Requirements
In your Azure subscription, your account must have “Microsoft.Authorization/*/Write” access to assign and AD app to a role. This action is granted through “Owner” role or “User Access Administrator” role. “Contributor” role will not have the required permissions.
Virtual machine requirements,
- VM Operating System : Linux (ubuntu 18.04)
- VM Size : Standard D2s v3 (2 vcpus, 8 GiB memory) is more than enough
- SSH access : username and password.
- Default port : 3000
- NSG rule : open an inbound rule in network security group with
limited access to port 3000 and 22 for SSH. - Assign a static public IP address to the VM
MySQL Creation and Linking to Grafana
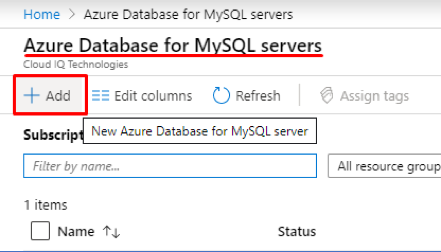
1. Create an Azure database for MySQL server from
2. Select the resource group, provide Server name, admin username, password, confirm password. Take a note of the password; it is used several times throughout the set-up.
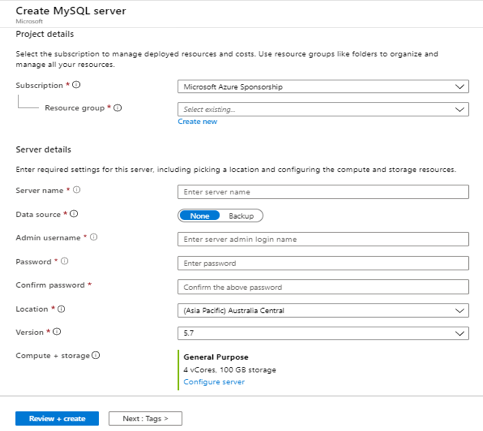
3. To select compute and storage,
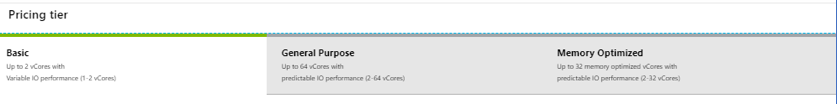
a. There are three pricing tiers, (choose basic)
- Basic
- General-purpose
- Memory-optimized
b. Select the appropriate sizes.
- Computer generation: Gen 5
- vCore: 1
- storage: 5GB
- Auto-growth:
- Backup retention period:
- Local redundant / Geo-Redundant
For basic compute and storage,
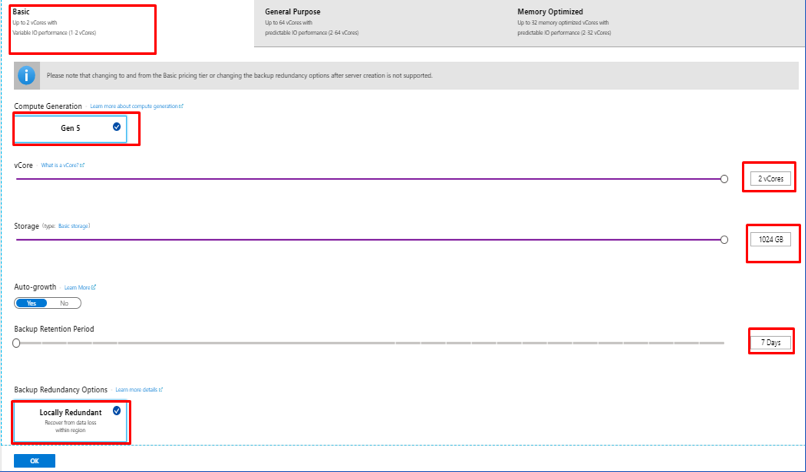
The maximum vcore is 2, and Storage is 1024 GB. Choose as per your needs.
4. Then click Review+Create
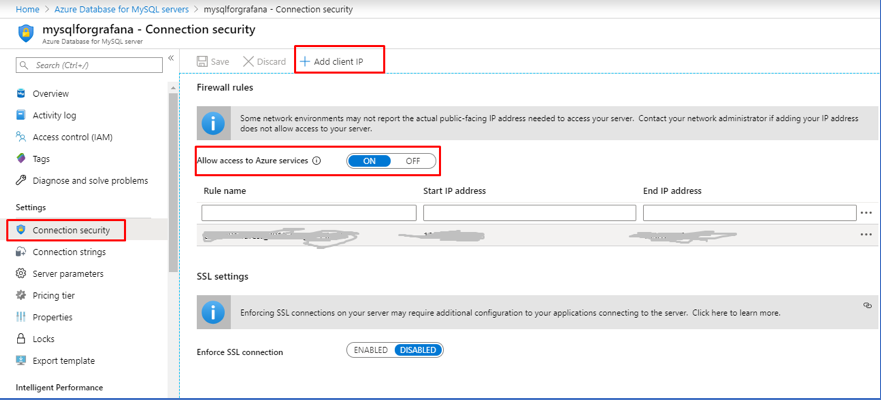
5. Once the Azure database for MYSQL server is deployed, go to connection security and do the following changes,
- Add a client IP.
- Set “Allow access to Azure services” to ON
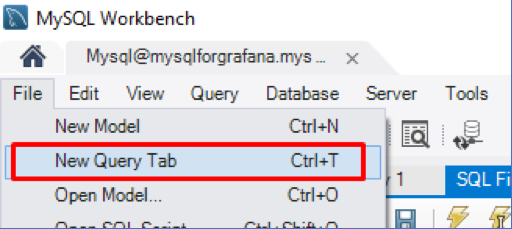
6. Do the following in the SQL server by connecting to it using the Server admin login name and password in SQL workbench. Create a new query tab. (You can use any tool to connect MySQL)
7. Run the following commands in the query tab,
- create database named “grafana” ;
8. Now the SQL server-side configurations are over. We need to provide the inputs of SQL server configuration to docker containers running Grafana.
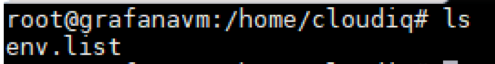
9. Login to the VM running Grafana using appropriate SSH credentials (password or access keys).
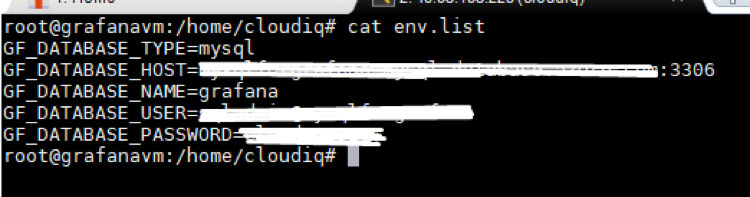
10. Note the following values and save them as environment variables as an environment list.
Type = mysql
Host = <servername>:3306 (mysql server name created earlier)
Name = grafana (DB name given in the earlier steps and given access)
User = <Server admin login name>
Password = <server login password>
11. Save the changes mentioned above as a list. As shown,
Installing Grafana as a docker container and required its plugins
1. Login to the server using appropriate credentials,
2. Get updates using, sudo apt-get update
3. Install docker using the command, sudo apt install docker.io
4. Enable and start docker,
- sudo systemctl start docker
- sudo systemctl enable docker
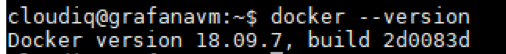
5. Verify the installation using the command,
- docker –version the result will be like this,
6. Now login as root using the command,
- sudo su
7. Pull Grafana image; this needs an Internet connection as this will download the image from a public hub of docker
- docker pull grafana/grafana
8. Run the image with saved environment variables,
- docker run -d –name=grafana -p 8000:3000 –env-file ./env.list grafana/grafana

9. verify the container installation using “docker ps” command

10. The next step is to install the plugins for Grafana, which will be used in setting up the dashboard. We need to login to the container created previously to install these plugins.
11. Now create a shell inside the container using,
- docker exec -it grafana /bin/bash
12. The result will be as shown,

13. By default, in Grafana dashboard there’ll be limited number of panel plugins, to use more visualization we can manually install plugins. Now copy the plugin installation commands listed below and run them one by one or everything at once.
- grafana-cli plugins install michaeldmoore-annunciator-panel
- grafana-cli plugins install grafana-piechart-panel
- grafana-cli plugins install farski-blendstat-panel
- grafana-cli plugins install michaeldmoore-multistat-panel
- grafana-cli plugins install grafana-polystat-panel
- grafana-cli plugins install flant-statusmap-panel
- grafana-cli plugins install grafana-clock-panel
- grafana-cli plugins install neocat-cal-heatmap-panel
- grafana-cli plugins install briangann-gauge-panel
- grafana-cli plugins install natel-plotly-panel
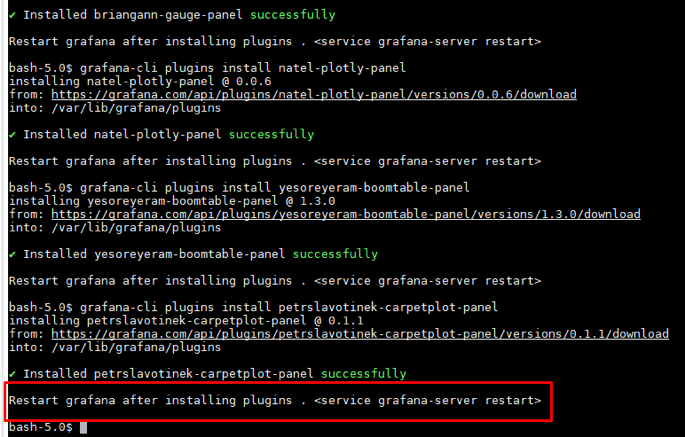
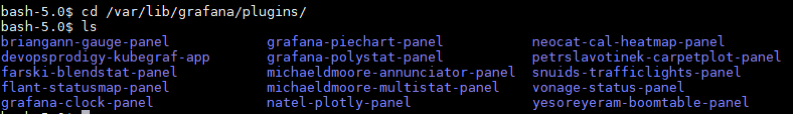
14. Once the plugins are installed,
- verify the installation by going into, /var/lib/grafana/plugins directory by using the commands listed below
- cd /var/lib/grafana/plugins
- to view installed plugins, use ls command
15. Now exit the container, command: exit
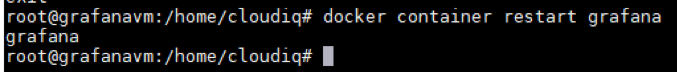
16. Now restart the container using,
- docker container restart Grafana (here “grafana” refers to the container name created earlier, which can be found using docker ps command)
Linking Azure Monitoring Tools
Service Principal
- Register an app in Azure Active Directory (AD).
- Create a client secret in the Registered app.
- Go to subscription à IAM à search for the app registration and provide “READER” access to the registered app in the Azure AD in first place.
Applying the service principal to Grafana,
- Go to Grafana UI by using public IP address followed by port number,
i.e., (IP address):3000 example: 13.25.49.164:3000 - Now Add data source. And click select
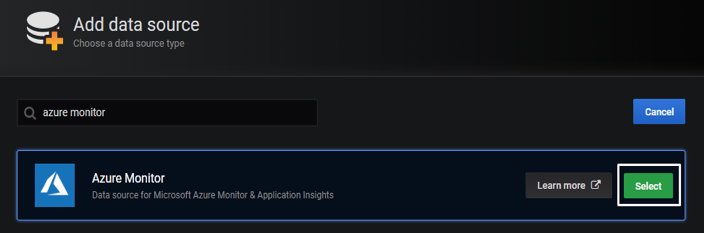
- This page will appear, input the tenant ID, client ID, client secret.
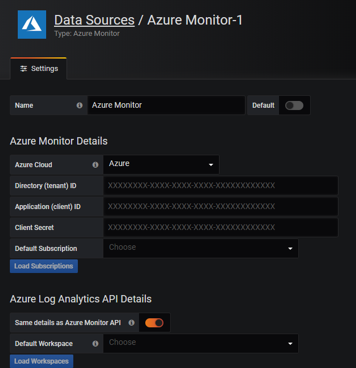
- Then provide details for log analytics workspace and Application insights.
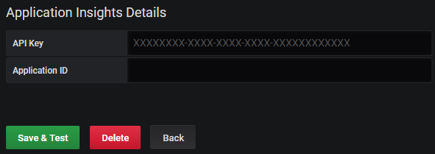
- If the provided details are correct this message should be displayed.

Share this:
CloudIQ is a leading Cloud Consulting and Solutions firm that helps businesses solve today’s problems and plan the enterprise of tomorrow by integrating intelligent cloud solutions. We help you leverage the technologies that make your people more productive, your infrastructure more intelligent, and your business more profitable.
LATEST THINKING
INDIA
Chennai One IT SEZ,
Module No:5-C, Phase ll, 2nd Floor, North Block, Pallavaram-Thoraipakkam 200 ft road, Thoraipakkam, Chennai – 600097
© 2023 CloudIQ Technologies. All rights reserved.